
3 Steps to Get Started With Fundraising Data Analytics
For the past six years, charitable donations have continued to grow. Within the past year alone, giving increased by 4.1%. However, many nonprofits still lose out on potential revenue despite this growth. How can your organization maximize revenue?
Using fundraising data analytics is a great place to start.
Fundraising analytics provide a way for nonprofits to measure the effectiveness of campaigns. Your nonprofit can develop a list of strengths and weaknesses backed up by concrete data. This makes it easier to adjust fundraising strategies based on past performances.
In this guide, we’ll walk through the steps to getting started with fundraising analytics. After learning about the different types of fundraising analytics, you’ll read about selecting metrics and collecting the right data. Lastly, we’ll discuss how to analyze data.
In this guide, we’ll cover:
Want to know how to use data to improve your nonprofit’s fundraising strategy? Keep reading to learn more.

What are fundraising data analytics?
Fundraising data analytics is the process of collecting useful fundraising data and analyzing patterns within that data. This gives your nonprofit a basis to build on current fundraising strategies by using metrics that quantify performance.
There are three distinct kinds of fundraising data analytics— descriptive, predictive, and prescriptive. Each of these plays an important role in the overall fundraising data analytics process.
Next, we’ll delve into what makes these types of fundraising analytics unique.
Descriptive Fundraising Analytics
Descriptive fundraising analytics provides information that describes your donors’ behavior. These metrics create classifications for donors based on their past interactions with your organization.
This information provides key insights into donors’ giving habits and behaviors. Common information found in this category includes metrics like donation amount, donation method, and demographic information.
Predictive Fundraising Analytics
Predictive fundraising analytics build off of the foundational data provided by descriptive fundraising analytics, identifying patterns and trends. These patterns in donor behavior are used to predict donors’ future behaviors.
There are a few things to look for when performing a predictive analysis. The point of predictive fundraising analytics is to reveal patterns in your data, so you should keep an eye out for pattern indicators. We’ll talk about this more later, but common pattern indicators include donation growth and fundraising return on investment.
Prescriptive Fundraising Analytics
Prescriptive fundraising analytics combines the information gathered from descriptive and predictive analytics. Here, donor classifications and predictions about their future behavior inform a nonprofit’s future fundraising strategy.
Prescriptive fundraising analytics provides concrete measurements about past and future fundraising campaigns. The insights gathered inform a nonprofit of its unique needs and how to address them. Nonprofits also walk away with a better understanding of key donor information like giving capacity, which can help maximize fundraising efforts.
A great example of prescriptive fundraising analytics is prospect research. This research focuses on finding prospective major donors based on their giving capacity and affinity.
Giving capacity refers to a prospect’s financial ability to make a major gift— something that can be ascertained using descriptive fundraising analytics. Giving affinity refers to the likelihood that a prospect will want to make a major gift, often ascertained by examining their past giving behaviors— a predictive analytics practice. The combination of the two, prospect research, is the ideal example of prescriptive fundraising analytics.

Getting Started with Fundraising Data Analytics in 3 Steps
The most important steps for getting started with fundraising analytics are choosing your metrics, gathering the right data, and analyzing that data. We outline how to accomplish each step and some best practices to keep in mind.

1. Selecting Fundraising Metrics
Metrics are the foundation for all the insights you gather, so understanding them is key. We’ll cover what fundraising metrics are, list some common examples, and explain how to choose the right ones.
What are fundraising metrics?
Fundraising metrics, sometimes called key performance indicators (KPIs), are data points that are used to measure the strength of fundraising performance. If your nonprofit uses the Google Ad Grant program, you may be familiar with performance indicating metrics such as click-through rate and conversion rate.
Metrics can highlight growth from one campaign to the next. On the other hand, they can also point out weaknesses or stagnation.
8 Common Fundraising Metrics
There are many different metrics to consider, and choosing them depends on your organization’s goals. This list is far from exhaustive, but it gives you a starting point with fundraising metrics.
Here are eight common fundraising metrics:
- Donation volume: This metric references the number of donations your nonprofit received within a designated time frame.
- Average gift size: Average gift size reflects how much a gift is on average. You can measure the average gift size from individual donors or the overall average within a given time period. Both of these variations will provide useful insights.
- Gift recency: This metric refers to how recently an individual donor made a donation.
- Gift frequency: Similar to gift recency, gift frequency indicates how often a donor donates.
- Demographics: Demographics are characteristics or traits of your donors. These can include age, gender, and location.
- Wealth markers: These factors are similar to demographics. However, they are indicators of a donor’s financial ability to make a gift. This includes things like real estate ownership, job title, and stock ownership.
- Affinity Markers: These reference how willing the donor is to make donations. This includes factors such as past donations, volunteer history, and more.
- Return on investment (ROI): ROI represents the total revenue your organization gains from promotional activity over the total cost. A promotion could be something like a fundraising campaign or event. ROI is a great metric for determining efficiency.
Metrics like these can help you evaluate your fundraising strategy from an objective perspective. By using these concrete performance measures, your campaigns should improve as you identify strengths and weaknesses.
Common Website Analytics
Your website can give you insight into fundraising performance. With tools like Google Search Console and Google Analytics, you can monitor all sorts of data.
However, some metrics are more useful than others. Here are a few website analytics we recommend keeping an eye on:
- Traffic Sources: How do people find your website? For instance, organic traffic refers to people who land on your site through Google or Bing, while referral traffic refers to visitors who land on your site from another website. Then, you have social traffic, which allows you to see which social media platforms drive users to your site. This can provide insight into how to best connect with prospects.
- Ad CTR: If you’re using a platform like Google Ads to promote your website, keep an eye on your click-through rate. This is the number of people who click your ads divided by the number of impressions (i.e. people who see your ad).
- Conversions: Your conversion rate describes how successfully your site turns visitors into supporters. A conversion might refer to a donation, volunteer registration, petition signature, or newsletter sign-up. Poor conversion rates might indicate poor CTA wording or placement.
- Session duration. How long are people staying on your site before leaving? If they immediately leave, your website might not provide sufficient information to meet visitors’ needs. If certain landing pages have a high bounce rate, re-evaluate whether you meet the searcher’s intent for its ranking keywords and then revamp the content.
Especially if you’re promoting your website with Google Ads, partner with a Google Ads agency to monitor these metrics. You can integrate your Ad Grants account with Google Analytics to monitor your ad campaign metrics alongside other site data. Not to mention, having an expert on your side will help you interpret that data and make positive changes to your website and its ads.
How to Choose the Right Metrics
Knowing which metrics to track is half the battle when it comes to fundraising analytics. The most important thing to remember are your goals as a nonprofit.
With this in mind, here are a few helpful tips for choosing the right metrics:
- Set goals that are tied to metrics. When you are creating goals for a fundraising strategy, select goals that are connected to specific metrics. For example, make it a goal to increase donations and use a metric like average gift size to measure your success.
- Use metrics that will benefit future fundraising efforts. While you should have goals specific to each campaign, it is also a good idea to identify overarching goals for your nonprofit. Note consistent weaknesses for your organization and choose metrics that measure those areas. That way, you can track strong and weak performances across different campaigns.
With so many metrics to choose from, narrowing them down can be overwhelming. These tips will prepare you for data analysis and ensure your insights are useful.

2. Collecting the Right Data
After you choose metrics for your fundraising strategy, you’ll need to collect the data to analyze.
How do you collect data?
Fundraising data analytics relies on gathering fundraising metrics. This data can include information about your donors and information about your campaigns themselves.
Data collection happens at every touchpoint your nonprofit has with a donor. For example, when a donor makes a donation, your nonprofit gains access to several data points. Things like gift size, frequency, recency, and donation method can all be derived from one touchpoint.
The data your nonprofit collects is both automatically collected by software and added manually by staff members. Online interactions are easy to add automatically, but some donor touchpoints require manual input. Logging interactions and contact information at an event, for example, will need to be added by hand.
Supplementing Your Data
While there are many metrics your nonprofit can capture on its own, there are often gaps in what you can collect. Data append services like NPOInfo are a great investment for filling in those gaps. NPOInfo is tailored to helping nonprofits and offers a wide variety of quality services.
For example, NPOInfo offers the following services:
- Employer appends: With an employer append, NPOInfo provides your nonprofit with information about your donors’ employers. The key data points like employer name, job title, and matching gift information clue your nonprofit in to more fundraising opportunities. This data can be difficult to append on your own, and the insights gained can directly increase fundraising revenue.
- Email appends: Emails are one of the most important donor touchpoints to maintain. However, if you are missing donor emails, it can be hard to know where to start. NPOInfo offers highly accurate email appends to foster meaningful communication to donors.
- Date of birth appends: Demographic information like age can help your nonprofit understand your donor base. But, gathering birth dates on your own can be difficult and time consuming. Consider NPOInfo as a simple, hassle-free option.
NPOInfo helps nonprofits append the data they need to create the best possible fundraising strategy. Contact us here to learn more about our data append services!
Data Collection Best Practices
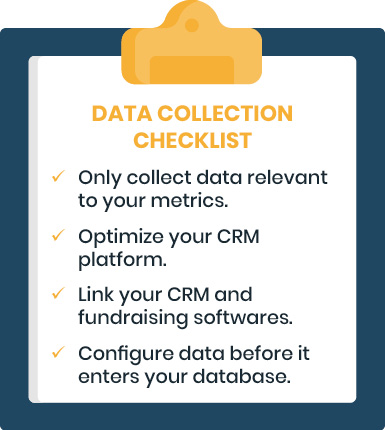
Here are some best practices when collecting data:
- Only collect data relevant to the fundraising metrics you identified in the previous section. Collecting useless data limits the efficiency of your data. For example, if your goal is to increase gift frequency, collecting data related to your ROI will not be helpful. Carefully select data points so you only have to work with the data you need.
- Optimize your constituent relationship management (CRM) platform. This is where your fundraising data will live, and it should include a full picture of all of your organizational data. If your CRM is disorganized or unable to integrate with your other software solutions, it’s worthwhile to look into upgrading your solution.
- Link CRM software and fundraising software. Connecting the two can reduce manually inputting information. New information is exchanged automatically between the softwares when they are connected, reducing the amount of work you have to do.
- Configure data before it enters your database. Before loading any data, set up any tags you would like to track. This could include things like donor name, gift data, and donation source. Setting up tags helps you stay organized, especially when dealing with a lot of data.
These strategies should help you collect accurate, useful data. Keep them in mind as you collect these pieces of information so that your database remains organized.

3. Analyzing Data
Now that you’ve selected the metrics you want to analyze and collected the corresponding fundraising data, you can get started analyzing the data.
Identify trends in your data.
Use predictive fundraising analytics to identify trends in your fundraising metrics. Your nonprofit can use these trends to create possible predictions for future campaign behavior.
For example, you might look for trends such as:
- Growth in donation size: If the amount of individual donations is increasing across your campaigns, consider what caused the change. Pinpoint the reason for the change, like a new donation appeal strategy, and note the impact it had. This will allow your nonprofit to replicate the positive results in the future and see more increases in donation size.
- Participation: Participation from supporters, which you can measure through things like event attendance, marks how invested donors are in your nonprofit. Note the impact any changes have on participation and plan to replicate any successes. If marketing events on Instagram doubles attendance, market all future events this way.
- Fundraising ROI: Return on investment is an important measure of efficiency. This will tell you how much you spent on a fundraising campaign versus how much you made. As you experiment with different fundraising strategies, observe how ROI changes. Retire strategies that impact ROI negatively and continue using those that increase it.
- Online donations: More specifically, this metric tracks what percentage of your total donations come from online sources. Marketing to a younger audience, for example, could bring in more online donations. Note this success and continue to market to them while planning for how to increase these donations even more.
By identifying trends in your nonprofit’s overall fundraising, you can predict outcomes for future campaigns. Your future campaigns will reflect your hard work through increased revenue, participating, and ROI.
Form a strategy.
The final step in analyzing your data is forming a strategy. Your strategy should be based on the information gleaned from organizing donors and identifying donor relationships and focus on growing your nonprofit by building connections, establishing a clear goal, streamlining internal operations, and generally improving your fundraisers’ performance. Creating an effective strategy that will yield strong fundraising performance results is the ultimate goal in fundraising data analytics.
This part of the strategy is based on prescriptive fundraising analytics. Your strategy should be based on prospect research which we discuss further here. As a refresher, here are some pieces of information you can find in this step:
- Finding matching gift opportunities.
- Finding major gift donors.
- Identifying planned gift donors.
Strategy is the culmination of everything we’ve covered. A strategy based on concrete insights and carefully analyzed data could be the push that your fundraising campaigns need.
Fundraising data analytics can give your nonprofit a boost when it comes to how effective your fundraising strategy is. You can maximize fundraising revenue by gaining a deeper understanding of your nonprofit’s strengths and weaknesses through fundraising metrics. These steps are not always simple to navigate, but we’re confident that you can give your organization’s strategy a refresh using fundraising data analytics.
Gathering data can be the trickiest part of fundraising data analytics, and doing it on your own is a huge undertaking. Luckily, services like NPOInfo are great for lifting the burden of appending data off nonprofits’ shoulders. Contact NPOInfo today for a quote!
In the meantime, check out the following additional resources:
- 12 Essential Questions About Corporate Matching Gifts. This resource is a great place to start if you are interested in learning more about corporate matching gift programs.
- Nonprofit Marketing Ideas: Promote Your Cause Effectively. Need some ideas to revamp your marketing strategy? Explore this complete list to supercharge your fundraising and marketing all at once!
- Your Nonprofit Fundraising Strategy: Make Tech Work for You! For more information about fundraising strategy, check out this resource. Here, you can learn more about how to make existing technology do all the work for you!