Posts

Improving your website with web analytics starts with tracking these five metrics.

Improve Your Website with Web Analytics: 5 Important Metrics

Your nonprofit collects data all the time, from supporters’ communication preferences to their giving habits, demographics, and more. You probably use this information to enhance your fundraising and marketing campaigns to better appeal to supporters’ interests. Did you know you can also use data to help improve your website?

Website data gathered from sources like Google Analytics, along with donor data from your nonprofit’s CRM, can be used to develop a website that speaks to your audience and drives engagement. We’ll review these five specific metrics that can help you design a better website: 

  1. Donation page metrics
  2. Demographic data 
  3. Split testing results
  4. User behavior metrics
  5. Traffic sources

You can gather and assess this information on your own, or turn to a nonprofit web design professional to help translate your data into actionable insights. Either way, using your data to make informed web design decisions will pay off in the long run when you can generate more online support. 

1. Donation page metrics

Your nonprofit’s online donation page is the tool that turns casual website visitors into supporters. Understanding where your donation page is succeeding and where it’s missing the mark can help you make informed design decisions that boost your online fundraising results. 

Here are a few of the most essential donation page metrics to keep an eye on: 

  • Click-through rate: This is the percentage of website visitors who click on the link to your online donation page. You can boost your click-through rate by developing more enticing calls to action (CTAs) or by featuring your giving page more prominently on your website’s homepage or main menu. 
  • Conversion rate: This metric measures the percentage of people who visit your online giving form and actually donate. To improve your conversion rate, Kanopi recommends emulating the top nonprofit websites by making the giving process as straightforward as possible. Keep the design simple and uncluttered, use a clear and consistent tone, and make the page mobile-friendly. 
  • Average online gift size: Compare this metric to your average gift size for other channels like direct mail. If your average online gift size is lower than expected, you can try to increase it by offering higher suggested donation amounts or giving donors the choice to cover additional processing fees. 

By using data to inform your donation page design strategy, you can increase online conversions and turn your website into a more effective fundraising channel. 

2. Demographic data

Knowing more about your supporters’ backgrounds can help you design a website that resonates with them. When it comes to managing and tracking donor data, your CRM is your most powerful tool. Use your CRM to track demographics that are meaningful and applicable to your organization. Those could include: 

  • Age
  • Gender
  • Ethnicity
  • Employment information
  • Education level

Consider this data when redesigning your website to better appeal to as many audience members as possible. For example, if you discover many donors work for companies that offer matching gift programs, you can better highlight matching gift opportunities across your website and online donation page. 

If your CRM is missing critical demographic information, you can conduct a demographic append to add extra details. A demographic append pulls information from third-party databases to help you fill gaps in your supporter information. 

3. Split testing results

Let’s say you’re looking to redesign your nonprofit website’s menu but you aren’t sure what type of navigation will work best for your audience. You may currently have a vertical sidebar menu but want to find out if horizontal navigation will work better. 

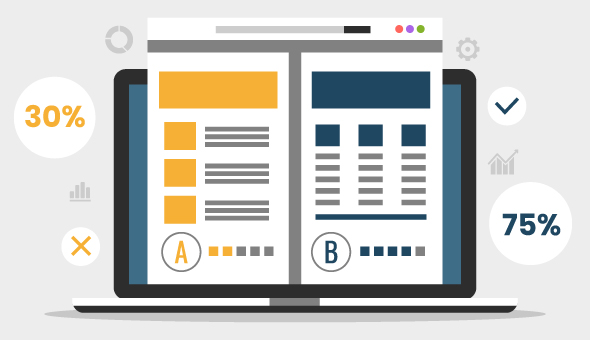
To determine the best path forward, you can carry out a split test (also known as an A/B test). You’ll create a new web page with a new URL that is identical to the original page but features a horizontal menu instead. Then, you’ll show both versions to similar audiences to gather feedback about which version performs better. 

Here is an example of what that A/B test might look like, with click-through rates shown for both menu options:

This image is an example of a split test, with a vertical navigation bar showing a 30% click-through rate and a horizontal navigation bar showing a 75% click-through rate.

In addition to your menu design, you can also conduct split testing for: 

  • Images
  • Videos
  • Calls to action (CTAs) 
  • Headers
  • Colors
  • Typography

You can assess practically any web design element with split testing to determine which options are more appealing to your audience. Through this evaluation, you can make informed decisions rather than acting on hunches. 

4. User behavior metrics

Different aspects of your website will naturally be more engaging than others, whether it’s your image slideshow, homepage video, or audience polls. You can determine exactly which page elements are most engaging by running a user behavior analysis. 

Using a website heatmap tool, you can understand how visitors engage with your website to determine opportunities for improvement and proactively identify user experience issues. 

Look into popular options like HotJar or explore the options available through your CMS. Drupal and WordPress both offer modules and plugins to conduct heatmap analysis in real-time.

Combine insights from a heatmap tool with Google Analytics to reveal the following metrics: 

  • Time on page. Determine how long visitors spend on each page before clicking away. 
  • Mouse tracking. See which buttons visitors click, how far they scroll down each page, and what areas of each page they ignore or engage with most. 
  • Direct user feedback via surveys. Incorporate website polls using feedback widgets to gather direct audience input. 

These user behavior metrics can help you collect data for your split tests, making it easier to determine the best path forward for your design choices. 

5. Traffic sources

Your website’s data can also reveal the success of your multichannel marketing efforts. By assessing your most popular traffic sources using Google Analytics, you can see which marketing channels drive the most cross-platform engagement.

Google Analytics groups traffic sources into the following categories:

  • Direct: typing your website’s URL into a browser
  • Referral: clicking a link to your website from another website
  • Social media: clicking a link to your website from a social media post
  • Email: clicking a link to your website from an email
  • Organic search: clicking a link to your website from a search engine
  • Paid search: clicking a link to your website from a paid search ad

Using this information, you can maximize your efforts on your most popular channels and build up outreach on other important channels that are underperforming.

For example, you might determine that your organic search traffic is thriving due to your robust SEO strategy, but your paid search ads could be more visible. In this case, you might consider applying for a Google Ad Grant. This program offers qualifying nonprofits $10,000 per month to spend on Google Ads, which are the paid search ads that appear at the top of search results pages.

Getting Attention’s guide to Google Ad Grant optimization recommends taking specific steps to make your paid search ad strategy more effective. These include using specific, long-tail keywords, targeting local audiences, and creating user-friendly, informational landing pages on your website.


Develop a process for continually reviewing these metrics with your nonprofit’s team. Practice good data hygiene by keeping your donor database and reporting processes organized and consistent. This will allow you to adapt to new audience preferences or trends to continue improving your website and appealing to supporters’ interests. 


5 Metrics to Track at Your Next Charity Auction: A Guide

Hosting a charity auction is no easy feat. With so many moving parts, from procuring items to reserving a venue, your nonprofit has to set aside ample time to prepare, execute, and reflect on your fundraiser. A critical part of this process is tracking performance metrics. 

Once you’ve set goals for your charity auction, tracking metrics before, during, and after your auction is a surefire way to assess your progress and modify your strategies. Metrics can give your nonprofit invaluable insight into how to maximize its ROI and leverage your events to drive higher engagement. By collecting data, you’ll be in a better position to adjust your approach and optimize your auction strategy in the future. 

To make the most out of your next charity auction and future auctions, you’ll need to pay close attention to the following metrics:

These data analytics can help you compile a list of strengths and weaknesses and find room for improvement. Then, you can revamp your fundraising strategy to drive revenue and meet your fundraising goals! Let’s dive in. 

Demographics

Understanding your target audience is pivotal to executing a successful charity auction. You’ll need to collect information about your supporters ahead of time so you can tailor your marketing strategy to them. 

An important demographic metric to look at is the average age of your target attendee. By understanding your target audience’s age, you can advertise your auction on platforms where supporters are most likely to see it. For instance, Facebook is great for older generations, while TikTok and Instagram tend to appeal more towards Generation Z and Millenials.

As people begin to register for your event, take a look at demographic breakdowns like age, gender, geographic location, and other relevant factors. This will provide you with invaluable insight into the best ways to reach your target audience and create hype around your event so attendees come ready to bid! 

Plus, you can use this information to guide your item procurement strategies. For example, if your target audience is typically parents, you can offer more family-friendly packages bound to inspire bids. 

Nonprofit involvement

You’ll also want to track supporters’ past involvement with your organization, such as looking at how frequently supporters give and the average donation amount. This can be done with your donor data management platform by creating donor profiles and tracking overall trends. 

Donors’ past involvement will help you better understand your registrants’ budget and how much they’re comfortable giving to your organization. As a result, you can procure auction items that fit their giving capacity so your nonprofit can maximize fundraising. 

For example, if your target attendees typically do not give large donations to your organization, choose cost-friendly items that donors are likely to bid on. According to the OneCause guide to charity auction ideas, popular auction items that are budget-friendly for your organization and its supporters include:

  • Gift baskets
  • Day in the life experiences
  • Local coupons
  • Nonprofit merchandise

If you’ve held an auction in the past, you can also look at metrics like the average bidding amount and number of bids per item. This will help you understand the items that most appeal to your target audience, ensuring that all of your items get a substantial amount of bids. You’ll also want to track these same metrics at your upcoming charity auction so you have this insight for future events. 

Conversion rate

Before your charity auction, you’ll need a multichannel marketing campaign to increase excitement over your event and boost the number of registrants. For example, your organization might choose to promote your charity auction on the following platforms:

  • Email
  • Social media
  • Your nonprofit’s website

Each of these platforms have their own analytics that are helpful to track in order to assess your marketing performance. For example, you can track open and read rate with email, number of likes and comments on social media, and incoming organic traffic to your nonprofit’s event landing page. 

However, the most notable metric you want to pay attention to before your event is marketing conversion rate. Conversion rate is the percentage of people who take the intended next action after seeing your marketing content. This could be the number of people that donate to your auction ahead of the event or register to attend. 

Conversion rate can help you adjust your marketing strategies to create more effective marketing materials. For example, let’s say that your nonprofit sees a low conversion rate with emails that promote registration for your next charity auction. As a result, you can modify your segmentation strategy, the frequency at which you send your emails, or make your call to action stronger. Experiment with different strategies to increase conversions and boost excitement over your event! 

During the event itself, you can look at the conversions, or how many bids are placed, for your auction items. This information can then be broken down into average number of bids per item or per guest, which items attracted the most amount of bids, and which items attracted the least amount of bids. These insights will allow you to strengthen your item procurement strategy for the future. 

Retention rate

Once you’ve held your auction, take a deep dive into how many people attended and donated toward your fundraising event for the first time, and how many people were recurring attendees. Retention rate helps your nonprofit understand how effective your charity auction was at engaging past supporters and maintaining their interest in your organization. 

While donor retention and acquisition are both effective ways for nonprofits to bolster their fundraising strategy, donor retention is more cost effective and essential to building a reliable donation pipeline. If you’re seeing low retention rates, consider how you can deepen your connections with existing supporters to boost their participation. 

For example, you can modify your communication strategies with more personalized emails, invite existing supporters to an exclusive in-person component of your hybrid auction, or be more explicit about the impact of recurring donations in your marketing materials. 

Fundraising ROI

Another important metric to track after your auction wraps up is your return on investment (ROI). ROI may sound like an oxymoron for nonprofits but trust it’s important to track! 

Your nonprofit likely invested a lot of funding into hosting an auction, whether through investing in online fundraising software, booking catering, or creating marketing materials. Once you’ve wrapped up your fundraiser, determine whether you made back the money you put into the event and extra to power your mission. 

A high ROI is a great indicator that your auction was a success. If you’re running at a loss or merely breaking even, your nonprofit has to do more in the future to use budget-friendly planning strategies and increase event revenue.

One way your nonprofit can save funds is by partnering with a local company. According to 360MatchPro’s guide to corporate philanthropy, a business can help you by offering in-kind donations for auction items and packages or providing financial support. Your nonprofit can partner with a local restaurant to offer a free dining experience or coupon booklet as one of your auction items. This will save your nonprofit money so you can boost your ROI. 


Collecting data is the best way to assess your nonprofit’s fundraising progress and determine how you can improve your strategies for the future. After you collect these metrics, take the time to review them so you can build a clear roadmap for future auctions. Remember to share relevant metrics, like your total funds raised, with your nonprofit’s audience so they understand the impact of their contributions and are more likely to give again.