Web Analytics for Nonprofits: A Mini Guide

Web Analytics for Nonprofits: A Mini Guide for the New Year

Web analytics help your nonprofit get to the heart of how supporters feel when they interact with your website. Curious about the impact of your marketing efforts on donation conversions? Want to know whether your calls to action (CTAs) are effective for driving engagement? A clear web analytics strategy can answer these questions and many more. 

The new year means new data collection challenges and opportunities for nonprofits. In this brief guide, we’ll provide an overview of how you can set up your web analytics strategy to improve your data-gathering approach as we head into 2024. Here are the top five tips that will support your strategy: 

1. Track the right metrics

There is such a thing as too much information when it comes to tracking metrics. Too much data can clutter your reporting processes and distract you from your highest-priority concerns.

Instead, keep your focus on the data points that are most relevant to your goals. These metrics might include:

Graphic showing nonprofit website metrics to track (listed in the bulleted list below)


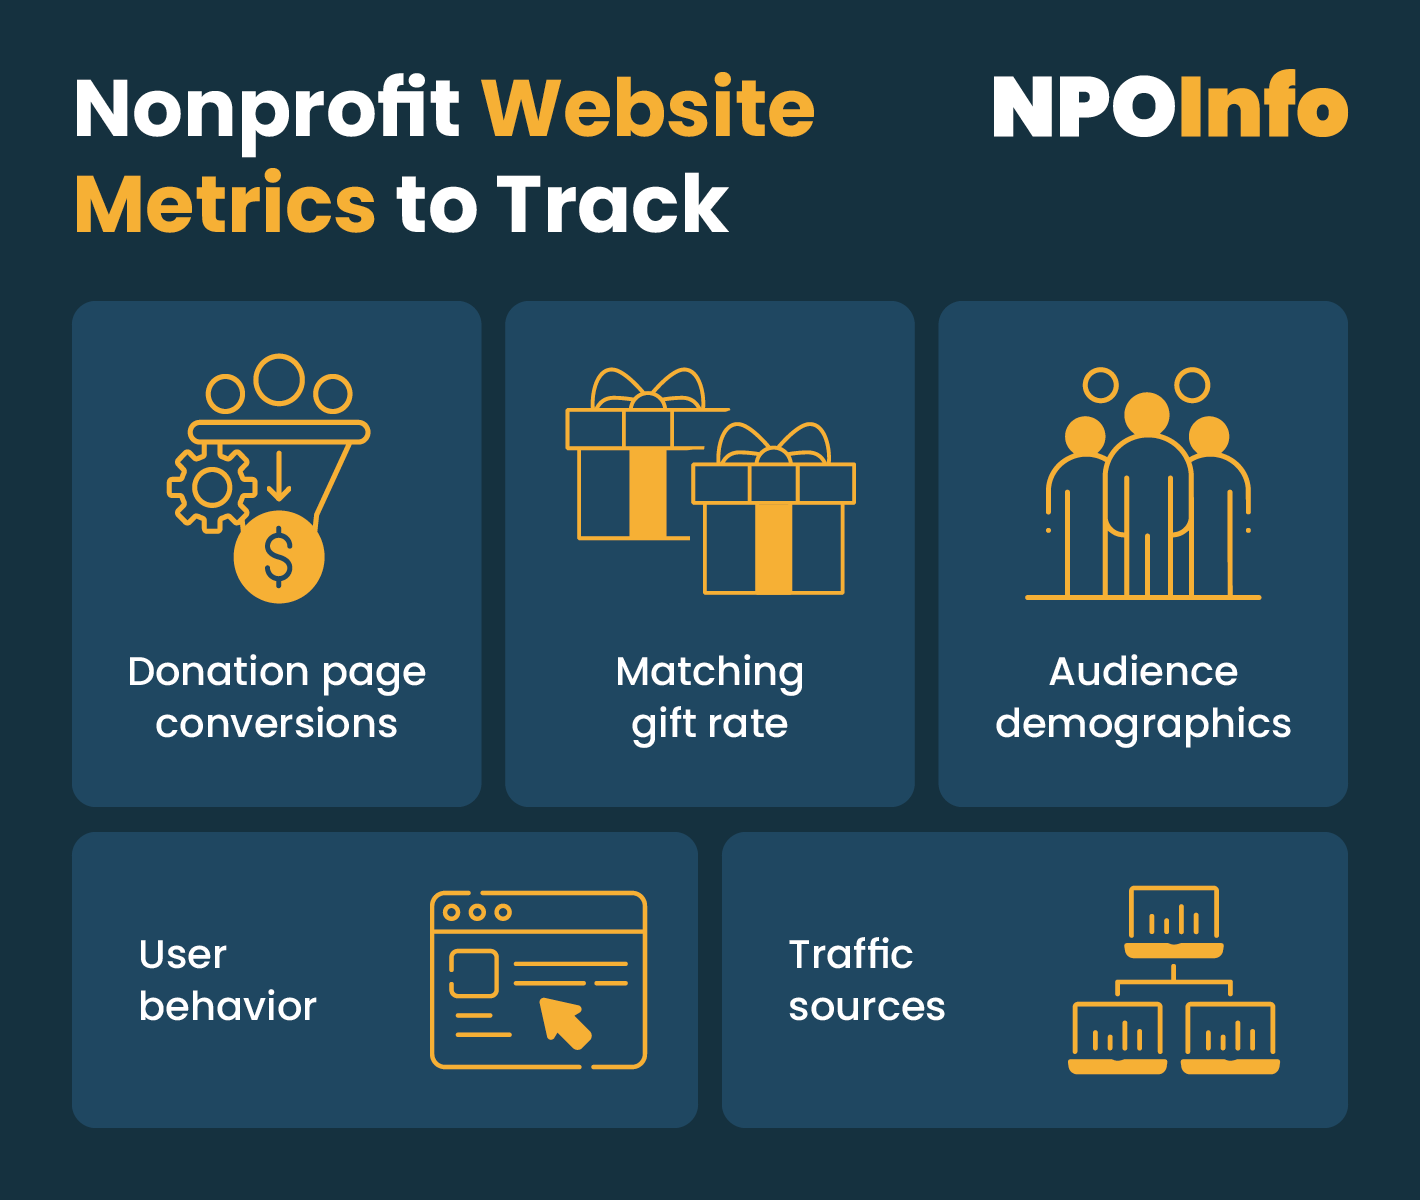
  • Donation page conversions
  • Matching gift rate
  • Audience demographics
  • User behavior
  • Traffic sources

You can use a combination of your content management system (CMS), user behavior tools like HotJar, and analytics tracking systems like Google Analytics 4 (covered in the next section) to assess these metrics. 

You can also use data-gathering tools like forms or surveys to gather data from supporters directly. Make sure these tools only ask for the necessary information that will support your data-collection goals. Eliminate any questions that lead to unnecessary information that will clutter your database.

Evaluate your metrics regularly using reports and assign staff members to implement strategy changes based on positive or negative trends. For example, perhaps you notice a major drop in donation page conversions in the early winter months. In that case, you could explore winter-themed fundraising ideas that drive engagement, such as a festive eCard campaign or holiday-themed text-to-give campaign.

2. Make the most of GA4

In the summer of 2023, Google stopped processing data in Universal Analytics to make way for the new GA4 platform. This was a major change for marketing professionals who had been using the Universal Analytics model for 11 years. 

As you get your GA4 dashboard up and running, make the most of this new model with the following tips: 

  • Familiarize yourself with the new functionality. According to Kanopi’s GA4 overview, this new model offers multiple updated features for web professionals to take advantage of. GA4 enables users to track users across multiple websites and apps, leverage AI and machine learning instead of cookies, and access greater insights into how marketing efforts impact conversions. 
  • Set up custom reports. You can develop up to 150 custom reports in GA4. Carefully choose variables such as the dimensions, metrics, and date range for each report to capture the insights that matter most to your nonprofit. 
  • Conduct team training as needed. Since GA4 is still relatively new, your marketing team may need some time to get familiar with the platform. Conduct a few training sessions so that team members know how to make the most of the platform. Consider working with a nonprofit web design professional to host these sessions. These experts know the ins and outs of GA4 and can help your team get up to speed quickly. 

Make sure your CMS is fully integrated with GA4 to streamline your analytics tracking. GA4 integrates with most major CMS platforms like Drupal and WordPress

3. Prioritize personalized web experiences

As we move into the new year, personalization will only become more important for nonprofits. 69% of consumers want personalized and consistent marketing experiences across multiple marketing channels, including digital platforms. 

The following strategies help nonprofits leverage web analytics for a personalized experience: 

  • Use analytics to design an experience that’s personalized to different audience segments. For example, you can use GA4 to identify which supporters prefer giving via mobile device or desktop. Then, you can follow up with these individuals and promote different giving opportunities based on their preferences. 
  • Prioritize a positive user experience. Use analytics and user behavior metrics to understand how visitors are engaging with your website, which pages they tend to linger on, and the pages that aren’t as successful in capturing their attention. Dig deeper and use heat map tools to understand what page elements make for a compelling web page. 
  • Make your CTAs more specific. Identify your primary audience segments by analyzing user research and audience personas. Then, develop a CTA strategy that speaks directly to the motivations and needs of each group. For example, you can create CTAs that encourage people to donate, register to volunteer, or become an advocate. 

One of the advantages of new tracking tools like GA4 is that they enable greater personalization without compromising donor privacy. For example, GA4 doesn’t store IP address information, granting users greater anonymity. Instead, it leverages machine learning techniques to help fill any gaps in data collection. 

4. Keep up with data privacy regulations

As data analysis and machine learning tools evolve, legal regulations surrounding data privacy and consumer protections are becoming more common. It’s important to stay aware of any data privacy and security legislation your nonprofit might be subjected to. 

These regulations typically depend on the geographic location where you carry out data collection and fundraising. Some laws you might need to comply with include: 

Consult with your legal team for a full understanding of the privacy regulations your nonprofit is subjected to and how you can adjust your data collection processes for full compliance. 

Also, be sure to maintain data hygiene to support a clean, uncluttered, secure database. Incorporate regular data backups and security updates as part of your data hygiene procedures to keep data safe.

5. Leverage integrations

Integrate your web analytics and reporting processes with your nonprofit’s other software solutions, like your CRM and marketing platforms. This enables seamless cross-platform data collection and analysis.

According to Bloomerang’s nonprofit CRM guide, integrations can save nonprofit staff members’ time and minimize data transmission issues. Plus, you can use data to create more personalized marketing outreach, improving your donor cultivation efforts and encouraging more donors to stay involved long-term.

For example, let’s say you want to create an online campaign to engage younger donors. Here are a few ways integrations can support this goal:

  • Using your web analytics and data-gathering tools, track behavior patterns for younger website visitors, such as the pages they browse the most or their giving preferences.
  • Combine this information with the data in your nonprofit CRM to create a user persona for your younger audience members. The persona should include information about users’ ages, online behaviors, reasons for engaging with your organization, and ideas for messages you can use to connect with them.
  • Then, design a multichannel marketing campaign using marketing integrations such as your email or social media marketing platform. Reference the information gathered in your personas to reach out with tailored messages that consider younger supporters’ interests and giving habits.

Speaking directly to supporters’ interests builds stronger bonds and long-lasting connections.


Growing your website from a standard platform to a truly great online resource doesn’t happen overnight. Understanding and implementing these tips now will set your organization up for success and provide the foundation you need to expand your fundraising efforts. 


This article will cover the key metrics needed to check your volunteer base performance.

How to Perform a Volunteer Check-Up: 3 Key Metrics to Assess

Your volunteer base is the engine that drives your cause forward. Without it, you wouldn’t be able to reach as many beneficiaries or complete the tasks that make positive change happen.

Many of your volunteers could likely recite your mission back to front, and probably a few have been rallying for your cause since before you can remember. But how well do you know them and their commitment to your cause? Aside from managing your volunteers during regular day-to-day activities, could you give a data-backed description of volunteer performance? Or, be able to forecast your volunteer recruitment numbers for next year?

While you can’t tell the future, you can reference your data to uncover critical insights about your volunteer program. That’s why we’ve written this guide—to give you three reliable metrics to check your volunteer program’s overall performance. Let’s jump in!

Volunteer Recruitment Metrics

These measurements help you better understand who is joining your cause, how many supporters are consistently signing up, and how effective the onboarding process is. Tracking data points can help you sufficiently allocate resources to either increase recruitment marketing or pull back and lean into improved retention strategies.

You might be able to give an answer for how many volunteers you think you need, but looking at metrics like these can reveal trends in your recruitment performance over the years. For example, if you notice a consistent dip in volunteer interest during certain seasons, you can adjust your fundraising event schedule to times when volunteer recruitment needs are low.

When reviewing your recruitment data, here are some metrics to keep in mind:

  • Acquisition rate. Broadly, this refers to the rate at which new volunteers are recruited. Determining your recruitment strategies’ effectiveness is crucial to see if you need to adjust your outreach methods for enhanced results.
  • Demographics. This describes the age, ethnicity, gender, and location of your volunteers, helping you understand your target volunteer base and align your recruitment strategies to appeal to this audience.
  • Time-to-onboarding. This rate measures how quickly a volunteer can become a fully competent volunteer familiar with your mission and their role. Nonprofits with shorter time-to-onboarding rates can improve volunteer satisfaction and engagement.
  • Volunteer source. This metric describes how volunteers discover your volunteer program. Referrals, Google Ads, and community events are all volunteer sources that can help you understand how volunteers are finding out about your organization. Tracking this metric lets you prioritize the marketing channels that yield the highest results.

Your volunteer source is especially important to help you structure your recruitment efforts. For instance, if referrals are a consistent source of new volunteers, you can look deeper into where your volunteers work and offer partnership opportunities with that company.

Funds2Orgs’ guide to volunteer recruitment suggests strengthening your connections with your volunteers’ employers by suggesting other mutually beneficial CSR opportunities. This could include programs like volunteer grants, which enhance the company’s reputation and give back to your nonprofit.

Volunteer Engagement Metrics

Keeping track of your volunteer engagement metrics is essential for understanding how well your nonprofit meets volunteer needs and expectations.

Your volunteer base’s sense of loyalty and motivation can affect both the quantity and quality of your nonprofit work. Engaged volunteers can bring new energy and enthusiasm into your operations, inspiring others to get involved.

Here are measures you can rely on to communicate your volunteer engagement levels:

  • Retention rate. This measures the percentage of volunteers who stay involved year after year. A nonprofit with steady volunteer retention levels may not need as much time and funding for recruitment as its current volunteer base meets its needs.
  • Turnover rate. The opposite of retention rate, turnover measures the percentage of volunteers who leave your nonprofit over time. High turnover rates can indicate poor volunteer management or unmet expectations.
  • Hours and task completion rate. These practical metrics describe how productive your volunteers are in your everyday activities.
  • Satisfaction rate. Satisfaction rate can be assessed through surveys and in-person feedback from current volunteers. It measures whether current volunteers feel fulfilled, motivated, and appreciated.

If you find any of your engagement metrics lacking, it could be a sign that your volunteers feel demotivated or unappreciated. Follow up with current volunteers to get their perspective and confirm. If you find yourself in this situation, Fundraising Letters’ appreciation guide suggests sending personalized notes, inexpensive gifts, or invitations to informal events to express gratitude. Small gestures can go a long way in engaging volunteers to keep up the good work!

Volunteer Impact Metrics

Impact metrics indicate the long-term change your organization has created due to its volunteer program. Measures like these can take a while to build up, but once you’ve curated a list, you can feel confident that your volunteers are generating positive community impact. Impact measures can also be more nuanced, which is why it’s best to separate them into qualitative and quantitative categories.

Qualitative volunteer impact measures the quality of a volunteer’s work over time and is often reflected in measures such as:

  • Level and value of community outreach
  • Client or beneficiary feedback
  • Volunteer-driven innovations
  • Volunteer stories and testimonials
  • Volunteer growth and development

On the other hand, quantitative measures are more straightforward and take into account numerical values associated with a volunteer’s work, such as:

  • Total beneficiaries served
  • Project milestones
  • Cost savings
  • Funds raised
  • Goods or services distributed

By reviewing the above metrics simultaneously, you can better understand the quality and quantity of your volunteer hours. Of course, each nonprofit will have different metrics that they emphasize more, but ideally, qualitative and quantitative measures should reflect positively on your volunteers.

Wrapping Up

Regularly track and update volunteer metrics to get a bird’s-eye view of your program’s performance. The more data you collect (both qualitative and quantitative), the better understanding you’ll have of your volunteer base needs.

Then, contextualize your findings to spot overarching trends that can inform your volunteer recruitment and retention strategies. You can do this by asking questions such as:

  • Which volunteer recruitment channels are most effective?
  • How does volunteer engagement frequency vary by role, season, or project?
  • Are there any surprising retention or satisfaction trends in the data?
  • Have changes in volunteer management, training, or onboarding affected satisfaction?

By digging deeper into your data, you can proactively address concerns. Simple adjustments in volunteer appreciation programs, onboarding resources, or role reassignments can help ensure all volunteers feel valued and motivated by your organization.

The Power of Data: KPIs for Your Nonprofit’s Next Event

Events are a fundamental part of the nonprofit world. Whether they’re raising money, spreading awareness, engaging volunteers, providing education, or giving back to your community, events can be incredibly powerful. However, as nonprofit professionals like you know, events take a lot of time, energy, and money to execute, so you definitely want to do everything you can to ensure success and improve year over year. Collecting and acting upon data during the event planning process is crucial, as is monitoring important metrics that correspond to your nonprofit’s goals by establishing key performance indicators, or KPIs.

Let’s review some common KPIs for nonprofit events in four major categories: attendance, fundraising, marketing, and impact.

Attendance

Attendance KPIs help you better understand the overall draw of your nonprofit’s events, both among your regular supporters and the general public, and track it year-over-year. It’s also useful to help you compare the response to the various offerings in your nonprofit’s event portfolio and inform decisions about continuing or discontinuing certain events. There are a number of KPIs to track related to event attendance, including:

  • Registration numbers. The sheer number of attendees for each of your events gives you a good idea about where your supporters’ interest lies in terms of event type and format, and where you should invest your time and effort moving forward.
  • RSVP response rate. Track the number of invitations you sent and the number of responses you received, in addition to the actual number of event attendees. This can give you valuable insight into the strategies you employ to invite potential registrants, your ticketing and RSVP process, and price points for registration.
  • Attendee demographics. The demographics you target versus those that actually attend paint a more detailed picture of your donor base for future marketing and donor cultivation purposes. For instance, let’s say you’re organizing a charity golf tournament. If you find that you get the best response from recurring donors or corporate partners, you can aim your future marketing efforts at these groups to boost your turnout.

Fundraising

The majority of nonprofit events are held with fundraising in mind, whether it’s the sole focus or just a component of another effort. To better understand how the fundraising outcomes of each event are affecting your organization’s bottom line, keep these fundraising KPIs in mind:

  • Total funds raised. This is perhaps the easiest metric to track, and helps you determine if you met or surpassed your fundraising goal for the event. Continuing with the golf tournament example, you’ll want to aggregate the dollars raised from golfer registrations, sponsorship sales, on-course games and contests, mulligan sales, raffle tickets, live or silent auction proceeds, and straight up donations to determine your gross funds raised.
  • Donation conversion rate. The donation conversion rate is the number of donations per number of attendees. The more attendees that responded to the ask to make a contribution to your cause, the higher your conversion rate. This metric helps you understand how engaged attendees are in the event and your cause and how you can make better asks during the event.
  • Average donation size. Look at the average size of the donations made during your event to glean whether your development team should focus on stewarding a few major donors or if you should more broadly target many, smaller donors.

Marketing

Successfully marketing your nonprofit’s event is crucial to its success. Tracking metrics to help you better understand the effectiveness of your marketing strategy lets you grow and scale your event year over year and make improvements to reach even more people. Consider using UTMs in any online marketing, which are a way of tracking where folks come from in online marketing campaigns, and tapping into analytics to get additional data about your marketing efforts. Here are a few marketing KPIs to consider:

  • Social media conversions. Social media has several KPIs you can track, such as post impressions, number of followers, and conversion rate. Impressions and number of followers can indicate how big of an online reach your event marketing has, while conversion rate can tell you how many of your followers feel inspired to take a desired action from your posts.
  • Email open/click-through rates. Email marketing is extremely effective if you can make your messaging compelling and inspire action, which is what your click-through rate measures. These metrics tell you the number of people that opened your and how many people click on your email’s calls-to-action.
  • Registration sources. Look at where folks are coming from to register for your event. Compare paper registration forms to phone calls to online registrations to determine the most effective ways to collect registrations in the future. Consider the time it takes for staff to process registrations and payments through the various methods to determine the most efficient ways moving forward.

Impact

The ultimate goal of your nonprofit’s events is to create an impact that furthers your mission, so it’s important to track metrics that show the direct results of the event. These KPIs could include:

  • Tangible outcomes. Determine how the dollars raised from the event will directly impact the populations you serve or the cause you champion. For example, the number of people helped, projects funded, or other specific outcomes achieved. If the event raised money for a specific project or initiative, be sure to share that information with donors so they better understand how their attendance contributed to the impact.
  • Donor retention. Measure how many donors who contributed to the event have continued to support the organization in subsequent months or years. A high donor retention rate indicates a successful event in terms of building long-term donor relationships.
  • Comparative analysis. Compare the event’s performance to previous events or similar initiatives to identify trends and areas of improvement.

How to Monitor KPIs

If collecting and tracking the above KPIs feels overwhelming, not to worry—technology makes it much simpler to monitor KPIs while keeping your data clean and up-to-date. A simple way to start collecting this important information is through feedback and surveys from event participants, donors, and volunteers and pulling information from your CRM or event management platforms.

Look for a powerful software solution that fits your nonprofit’s specific needs. For instance, charity golf tournament organizers should consider using golf tournament management software, like GolfStatus, so they can not only track the most relevant data, but streamline their event management strategies.

No matter what tech tools or software your nonprofit utilizes, ensure you keep data hygiene best practices in mind, such as regularly auditing your records. NXUnite suggests completing your dataset by appending missing information so you always have the best understanding of where you stand.

Final Thoughts

Data is powerful, and when collected and analyzed properly, can tell a story about your nonprofit’s events that sets you up for continued success. If you don’t have software in place to manage your nonprofit’s events, start by researching options tailored to the specific event and how the platform will help you collect and manage data. Next, do a deep dive into data hygiene practices and implement recommendations. Finally, determine a strategy for collecting the important data that inform KPIs that help your nonprofit reach its goals.

Collecting data can improve your hybrid auctions and fundraising efforts.

Hybrid Auctions: 7 Metrics for Your Nonprofit to Track

Gathering data is an incredibly important part of your nonprofit’s strategic planning. While it may not feel as exhilarating as planning your next big event or as exciting as landing a well-known title sponsor, analyzing your data helps with measuring your success and honing in on the new opportunities that will take your organization to the next level.

But, what is the right data to be looking at? How often should you be looking at it? There IS such a thing as analysis paralysis, right? While only you and your team can answer some of these questions based on factors that are unique to your organization, we can provide you with some pointers.

One such opportunity to collect information that will help you succeed in future campaigns is during your organization’s hybrid silent auction.

In this guide, we’ll cover seven metrics your organization can track in conjunction with your hybrid auction; both during the event and after it ends.

1. Registration Page Conversion Rate

Before you shudder and get scared of the word “conversion,” thinking back to your high school chemistry days, observing the conversion rate of a website is very simple:

Definition: Your registration page rate = those who arrive on your registration page vs. how many “convert” by signing up.

Importance: Analyzing your conversion rate will show you how impactful your registration page is and give you insight into what you could add or take away to invite more registrations. These variables can include headlines, colors, or even the use of photos on your page.

You might even use A/B testing, allowing half of your audience to see one version of your page and the other half another version to see which converts higher. Then, you can use this information to choose the best version and imitate it in future campaigns.

Application: If people are abandoning your registration page at the last minute, it means your marketing is working to get them there, but something else is driving them away. If you can identify this factor, you’ll be able to encourage more registrations in the future.

You can also use this insight both for fundraising and online auction pages in real time throughout your event to see how many people give during the event itself. This fundraising data will also allow you to raise more money in future campaigns.

2. In-Person vs. Online Attendance

Definition: How many people attended the event in-person vs. online.

Ask your registrants how they plan to attend right at the beginning of the registration process, on the initial form. This way, you can plan ahead, and the data can be stored in your auction software.

Importance: You can use this information to measure any significant differences, such as the amount of money raised, between the two audiences.

Application: This metric is important to measure before your event, because it will help you make decisions like how much event space or food you’ll need for your in-person audience. You should also track this information in donor profiles as a part of your CRM, allowing you to see who is showing up in person vs. online. This will help you market to these audiences in ways that will get their attention and best engage them in your future campaigns.

Understanding your in-person vs. online audiences will also help you to follow up and communicate relevant messaging after your event, and better predict your audiences for future hybrid events.

3. Percent of Value Return

Definition:Winning bid amount divided by fair market value.

Importance: The percent of value return shows you which items have the highest return on value – or – which auction items will give you the biggest bang for your buck!

Application: Knowing how the winning bids matched up against each item’s value is a highly beneficial tool when evaluating your silent auction. This can show which of your items are most popular and help you determine which category of auction items your audience prefers the most. Then, you can emphasize that category in future auctions.

4. Number of Bids Per Item

Definition: How many bids each auction item received. 

Importance: Knowing how many bids were placed on each item in your auction will show you how much interest people had in your items, and whether you were able to garner some friendly competition and bidding wars.

Application: If your average number of bids per item was lower than expected, you might have a couple of issues that need to be addressed. There are two key culprits in this situation:

  • Your bidding increments are too high. According to Handbid’s Silent Auction Rules, lowering your bidding increments — especially when the auction uses mobile bidding technology — will encourage more bids and more bidding wars.
  • You have too many auction items. Next time you might want to increase competition by decreasing the number of auction items per guest.

5. Event ROI

Definition:How much you earned from your event compared to how much you spent.

Importance: When it comes to looking at a nonprofit’s financials, supporters, board members and key stakeholders like to see high efficiency. Considering the cost of an event versus its fundraising potential should be the first question you ask before diving into planning any kind of event for your organization.

Application: If your ROI is low or, heaven forbid, in the red, you can take further action to decrease your spending and increase your revenue the next time around by doing the following:

  • Collect outright corporate cash sponsorships to drastically offset your expenses and increase ROI.
  • Collect in-kind sponsorships.Often more feasible for companies than large sums of cash, in-kind donations of food, decor, and especially auction items, will help to reduce the cost of your event.
  • Create more donation opportunities for people to engage in throughout the course of your event.
  • Identify valuable and hard-to-get auction items that will wow your audience and start a bidding frenzy that will be sure to increase your ROI!

6. Attendee Retention Rate

Definition: How many of your attendees return year after year.

Importance: Retention is less expensive than acquisition. In other words, it’s more expensive to gain a new attendee than it is to get an existing attendee to come to next year’s event. Knowing your retention rate will give you insight into how much people enjoyed your event and its activities.

Application: If your retention rate is lower than you’d like, here are a few things to consider:

  • The event’s timing: Did you change the time or day, the day of the week, or the time of year from last year to this year? This could be a key factor for attendees, based on many factors like school, work, other events, etc.
  • The event activities: Are people participating and having a good time? Do you have enough things to do throughout the course of the event? How was your event program? Was it compelling and did it flow well enough to captivate your guests’ attention?
  • Your stewardship strategiesSupporters who feel appreciated and communicated with throughout the year are more likely to come back to future events.

7. Attendee Satisfaction

Definition:How satisfied are your event attendees? 

Importance: Knowing how satisfied your event attendees are will show you if your event was engaging and impactful. If your attendees are excited about your event, think of all the free marketing (and more dollars!) that will give you when they invite their friends to next year’s event.

Application: One of the best ways to measure attendee satisfaction is to send out surveys via email after your event. Keep the survey simple, inviting them to rate each element on a scale. Then, ask for comments about what they liked and disliked at the event.

Knowing this information from your guests will help you to make adjustments for future campaigns based on their feedback. It also shows supporters you’re paying attention to them, which is excellent stewardship!

If you’re missing emails from supporters, you might decide to append email addresses so you can contact more of them with your survey and continue contacting them moving forward.

After you’ve collected this important data, save it in your CRM. Update it regularly and delete duplicate and outdated information. Properly maintaining your CRM keeps a clean database, making for more efficient communication and the possibility of both optimizing your guest list and raising more money at future fundraising events.

How to Collect and Use the Data In Your Donation Form

Whether it’s a physical sheet of paper or a page on your organization’s website, a donation form is a crucial component of any nonprofit’s giving process.

A donation form not only allows you to accept and record donations, but when created correctly, a donation form can unlock powerful data to track fundraising trends, make informed decisions, and strategize future fundraising efforts. Moreover, donation forms can reveal valuable insights into how supporters give to your organization and how best to communicate with them in the future.

With this in mind, in this guide, we’ll answer the following frequently asked donation form-related questions:

Before diving into building a data-driven donation form to boost giving to your organization, let’s first review its core components.

What is a nonprofit donation form? 

A donation form is a key tool used by nonprofits to collect information and process contributions. Donation forms can exist both as physical forms that supporters can fill out by hand and as digital forms that supporters can fill out on your online donation page.


At its core, your donation form should include fields for basic contact information, gift amount, and payment details. However, many donation forms include additional fields that help nonprofits better understand, thank, and retain their donors. Below, we’ve cataloged the most essential fields to consider including in your donation forms.

What should be included in a donation form? 

  • Contact information. Ask for donors’ names, emails, phone numbers, and physical addresses to follow up with thank-yous and personalized appeals in the future.
  • Donation amount. This is a necessary field to complete a donation, but it’s also important to understanding giving trends and knowing how close you are to reaching your fundraising goal.
  • Payment information. In order for a donation to be processed, you’ll need to collect information about how a donor plans to pay. 
  • Matching gift search. Including a matching gift tool on your donation form allows donors to determine if their employer has a corporate giving program that will amplify the impact of their donation.
  • Campaign-specific survey questions. Depending on the fundraising campaign, you might ask additional questions about how donors learned about your nonprofit and why they’re donating. To make your form as streamlined as possible, consider making these questions optional.
  • Thank-you landing page. Once donors submit their donation, automatically direct them to a thank-you page that suggests other ways for them to get involved in your cause.

Using these fields to collect donor information not only helps build out your donor database but also provides vital data and insights that can improve supporter engagements and further develop relationships. 

What data should you collect from a donation form? 

Each field in your form can translate into impactful giving data. As a result, you can learn more about your donors:

    • Personal information. When someone makes their first donation, the most basic information you’ll receive is their name and contact information. As a result, your nonprofit can use this data to address donors by their preferred name and title in your future solicitations to improve your chances of receiving a response.
    • Engagement history. Assess the frequency of a donor’s contributions and their average gift amount alongside other ways (volunteering, attending events, serving on your board) that they’re involved in your organization. With this information, you can predict the timing and amount of future donations you will receive from a given group of donors. 
  • Demographic information. Information about your donors’ educational background, age, location, hobbies, interests, and reasons for giving all serve to help you better understand and connect with supporters.
    • Employment info and matching gift eligibility. An individual’s business affiliations can give you an idea of their net worth and potential connections. Plus, if they work for a company with a matching gift program, you can reach out to begin the gift match process.
    • Payment preferences. People can make donations with cash, credit, debit, online payment systems, and checks. Tracking how donors give will help you tailor your future asks and the payment options you give your donors.
  • Communication preferences. Similar to payment preferences, knowing how your donors want to receive communications from your organization allows you to target your giving requests more effectively.

Even if you’re not able to collect all of this information in your donation form, that doesn’t mean those data points are lost forever. With just a core set of basic donor data collected in your form, a third-party provider can append additional data to enhance the information in your database.

How do nonprofits collect donation form data? 

While you can certainly collect donation data with hard-copy donation forms—and some donors will prefer that!—integrated online forms and fundraising tools make it vastly more manageable for you to organize, update, and analyze your fundraising data. As a result, your team can spend less time trying to catalog data and more time responding to trends and implementing your insights.

For the most effective data-driven donation forms, your nonprofit should plan to invest in:

  • A payment processor that helps you securely collect billing information, prevent fraud, export data, and avoid hidden fees.
  • A constituent relationship management (CRM) system to ensure your donor data is centralized and accessible for both future outreach and strategic planning.
  • An online fundraising platform, such as one of these solutions recommended by Re:Charity, to easily and automatically track donor data as supporters fill out your online donation form to make their gift.

When choosing solutions to create and process your donation forms, look for those that can be integrated into your existing systems. Always customize your tools and donation forms to fit the unique needs of your organization, collect the most impactful data, and streamline the giving process. 

Once you begin collecting donation form data, you can take the next steps to use this data to optimize your form and your requests for donations. iATS’s guide to accepting donations online recommends: 

  • Removing excessive and redundant fields that can slow down the donation process and lead to form abandonment.
  • Branding your form to align with your organization’s logo, colors, images, tone, and fonts.
  • Adding suggested giving amounts and recurring gift options to encourage donors to increase support for your organization.
  • Optimizing your form to automatically adapt to be accessible across different screen sizes.
  • Automating receipts and thank-you letters to send to donors immediately after the gift is processed.

As you collect more data, continue to refine your donation form to drive more conversions and maximize gifts. Good luck!


About the Author:

This is a guest post from Peggah Azarvash at iATS Payments. Peggah is a passionate iATS Payments’ Sales Executive with 10 years of experience, providing payment solution support and guidance to nonprofits.

Understand Your Data | Charitable Giving Statistics for 2022

Understand Your Data | Charitable Giving Statistics for 2022

Throughout the year, your organization collects data related to your donors, marketing campaigns, volunteers, and more. This information can help you decide how your organization should operate in the future. However, only examining your nonprofit’s own data is like attempting to solve a puzzle by only looking at the edges of a single piece. 

Instead, you have to benchmark and compare your performance to get the bigger picture of where your strategies are working and where they could go further.

Charitable giving statistics help organizations, from nonprofits and higher education institutions to health care organizations and associations, gain a better understanding of larger industry trends. These statistics can help organizations put their own data into a greater context, providing a benchmark for their overall performance and giving insights into how they may want to proceed moving forward. 

This report will explore a range of recent charitable giving statistics for four types of mission-driven organizations:

  1. Nonprofits
  2. Associations
  3. Higher Education
  4. Healthcare

Each section will provide a key takeaway to offer additional context for each set of statistics. Use this information to determine what the data means and how it relates to your organization. Let’s get started. 

Interested in expanding your nonprofit's data? Learn how NPOInfo's data append services can help. Learn more.

Explore these ten charitable giving statistics for nonprofits.

Nonprofit Charitable Giving Statistics 

In 2022, many nonprofits are still recovering from the setbacks of COVID-19 in 2020. Charitable giving statistics can give us a glimpse into how well nonprofits have responded to these challenges as well as how they intend to move forward. 

Learn more about nonprofit charitable giving statistics.

  1. December is still an important month for giving, but not as much as in previous years. Reports indicate that nonprofits receive 17-22% of their total annual fundraising in December, and giving levels depend heavily on organization type. Arts, animal rights groups, and higher education institutions have a steady flow of donations throughout December, while health, human service, and international organizations receive most of their donations on Giving Tuesday and December 31st
  2. 61% of donors claim that they choose which nonprofits to give to based on how well the organization uses their money. 
  3. Donors care about stories. 42% claimed that personal stories from a nonprofit’s beneficiaries influenced their decision to give. 
  4. Nonprofits should educate donors about different ways to give. For example, studies conducted on planned giving found that over 40% of the donors surveyed learned about planned giving from a nonprofit organization. Studies also emphasize the importance of having conversations about planned giving early, when donors are in their 50s and 60s, rather than waiting until later in life to build long-term relationships prior to the bequeathment. 
  5. The golden rule of donating continues to hold strong: only 20% of donors give after their first gift, but donors are 60% more likely to become recurring donors after their second gift. 
  6. Despite the challenges of 2020 and 2021 due to the COVID-19 pandemic, the total giving rate is predicted to continue rising in 2022, increasing by 5.7%.
  7. For affluent donors, a nonprofit’s mission and their history with an organization almost equally influence their decisions to donate. According to recent surveys, 44% of affluent donors stated the issues a nonprofit addressed were the most important factor in their decision, while 44.5% claimed it was due to the organization. 
  8. Donors often don’t give simply because they’re not asked. A survey of wealthy donors found that about 20% of participants did not give due to not being asked, while 22% didn’t give due to not having a connection with a charitable organization. 
  9. Donors who give to one organization are likely to give to several others, as studies have found that 43.3% of wealthy donors give to five or more nonprofits. 
  10. Ultimately, different nonprofits have had different experiences with the pandemic. While 45% of nonprofit leaders reported decreases in fundraising revenue, 31% reported increases in donations.  

Takeaway

While COVID-19 has impacted charitable giving for nonprofits, many well known beliefs about nonprofit fundraising, such as the golden rule and the importance of year-end fundraising, continue to remain true. Overall, statistics show that nonprofits can benefit most from creating connections with supporters to encourage increased and more frequent donations. 

Explore these 10 association charitable giving statistics.

Association Charitable Giving Statistics

Economic instability can result in multiple changes for associations. During these times, some individuals will flock to associations to improve their skills and connections in hopes of re-entering the job market with better prospects. By contrast, others will lack the funds to continue renewing their annual memberships, resulting in a decrease in overall association revenue. 

Learn more about associations with these charitable giving statistics.

  1. Due to COVID-19, 50% of associations have reported having trouble reaching their fundraising targets.
  2. Membership fees are an important source of revenue for associations, making up approximately 46% of their total revenue. Plus, another 29% of revenue comes from fundraising events. 
  3. Only 1 in 3 associations feel their association software helps them achieve their fundraising goals. 
  4. However, despite this focus on decreased revenue, less than 50% percent of associations track their eCommerce transactions. 
  5. Associations are seeing new highs in membership decreases with 47% of survey organizations reporting a decrease in members. Overall, smaller associations with limited budgets tend to experience decreases in membership more often than their larger counterparts. 
  6. Despite these challenges, the average renewal rate for new members has remained relatively stable at 72%.
  7. While some may assume that young professionals looking to improve their skills would make up the bulk of association members, reports show that Baby Boomers actually participate the most in associations, making up 34% of association members. By contrast, Millennials make up 21% and Generation Z makes up just 8%. 
  8. In terms of attracting support, word-of-mouth continues to be the most successful method with 57% of associations reporting it as one of their top three methods for attracting new members. This is followed by email (50%) and sponsored events (40%). 
  9. Half of associations believe their members stop renewing their membership due to lack of engagement with their association. And 38% of associations believe that they have trouble communicating their beliefs and values to members. 
  10. With these challenges, 62% of associations have considered adopting or have already adopted new membership models. Among new types of models, tiered is the most popular with 43% of associations changing their structure adopting it. 

Takeaway

Associations are aware of the challenges their industry faces and are actively considering how to improve their marketing, organization structure, and offerings. However, the negative trends in these statistics seem to primarily impact smaller associations, while larger organizations have the resources to continually reach new audiences despite current challenges. 

Explore these 10 higher education charitable giving statistics

Higher Education Charitable Giving Statistics 

Higher education as a whole has had to overcome the challenge of transitioning to remote and hybrid education. For many institutions, this change has resulted in reduced funding from previously reliable revenue sources, such as accommodation fees for student room and board. 

Subsequently, many institutions have become increasingly invested in relevant charitable giving statistics as they strive to stay connected with donors to continue supporting their programs while managing the long-term impacts of COVID-19. 

Check out these top charitable giving statistics for higher education institutions.

  1. Adjusted for inflation, education organizations saw an increase in total giving of 7.7% to reach an estimated total of $71.34 billion. 
  2. Approximately 3 out of 4 affluent donors gave unrestricted gifts to higher education institutions in response to COVID-19. 
  3. Online giving has become more important for higher education organizations, as reports show a 10.4% year-over-year increase in online giving. 
  4. Higher education institutions continue to rely on a diverse set of fundraising revenue streams, with approximately 9.85% coming from individual donors, 7.74% from government grants, and 3.41% from fundraising events.
  5. Higher education organizations receive the highest average individual donation of any nonprofit sector at $1,671. 
  6. Alumni are a major giving audience for higher education institutions, contributing approximately 26% of all higher education gifts. 
  7. More than 1 in 5 donors claim that supporting education-related causes is important to them.
  8. 33.4% of women claim education is one of the causes that matters most to them, compared to 25.4% of men. 
  9. Higher education has faced obstacles with online learning, and nearly 75% of university students report being unsatisfied with remote learning, which university leaders fear could lead to a generation of unengaged alumni and lower donations. 
  10. Funding sources typically categorized as “others,” specifically donor-advised funds, have significantly increased their contributions to higher education institutions as compared to other types of donors, contributing approximately 11% of total gifts. 

Takeaway

The statistics show an overall leveling off of funds with support primarily coming from alumni and family foundations with connections to specific universities. Professionals in higher education advise other leaders to be vigilant of long-term statistical trends, particularly warning universities that lack major endowments and high-level brand recognition about the potential loss of future major donors due to a lack of engagement caused by remote learning. 

Explore these 10 healthcare charitable giving statistics.

Healthcare Charitable Giving Statistics

The COVID-19 pandemic has caused a resurgence of interest in supporting health-related organizations. But has this interest translated to donations? The answer has also only become more complicated as the pandemic has stretched over multiple years, as these giving statistics show. 

Explore these healthcare charitable giving statistics

  1. Most individuals prefer to give to local healthcare and basic needs organizations, as 90% of wealthy donors gave to community organizations in response to the pandemic, while only 35.4% gave to national organizations. 
  2. Contrary to assumptions, healthcare organizations as a whole actually saw a 3% decline in giving due to the pandemic. However, 42% of health service organizations saw an increase in donations. This is likely due to reduced participation in fundraising efforts for disease-specific organizations with objectives other than fighting COVID-19.
  3. In response to the pandemic, 49% of wealthy donors who gave to healthcare organizations did so to help hospitals and healthcare organizations obtain needed supplies.
  4. Wealthy donors also primarily gave unrestricted donations (74.8%).
  5. Health-related causes are the third most popular cause affluent donors give to with nearly a third of donors contributing to these organizations. This puts health-related causes behind only basic needs causes (57.1%) and religious organizations (46.9%). 
  6. Donations from individuals are an important revenue stream for health-related organizations, making up 22% of their total funding. 
  7. Healthcare-related organizations received the largest percentage of corporate gifts of any industry type at 35.3%. 
  8. Healthcare organizations have seen a reduction in donors but an increase in gift sizes for years now, with 75% seeing fewer total donations but 46% earning more in dollars raised. 
  9. Healthcare organizations tend to have lower than average donor retention rates when compared to other nonprofit sectors. However, the retention rate has been increasing in recent years. While there is only a 25% retention rate for first-time donors, this rises to a 66% retention rate for online multi-year donors. 
  10. In-kind donations are also on the rise for health-related organizations, increasing by 61% with an estimated $170 million in value. 

Takeaway 

While there is a global interest in helping healthcare organizations, these charitable giving statistics show that individuals are primarily interested in supporting local organizations they have a relationship with first. This means health-related causes can most benefit from continuing to steward their donors to improve retention rates and gift sizes. 

Resources

Wrapping Up 

Charitable giving statistics help paint a wider picture of the overall giving landscape. Leaders at a variety of organizations can use them to put their own data into context, helping them make informed decisions about their future fundraising plans. Of course, this data is only useful if you understand how it relates to your organization’s specific situation. 

Collecting, storing, and maintaining data are all continuous tasks that can take up a considerable amount of a nonprofit’s time. You can ensure your organization is maximizing its efficiency and putting its data to the best use possible with the right strategies. Here are a few resources to help your organization learn more about managing your data:

Improve your fundraising strategy by enhancing your data today.